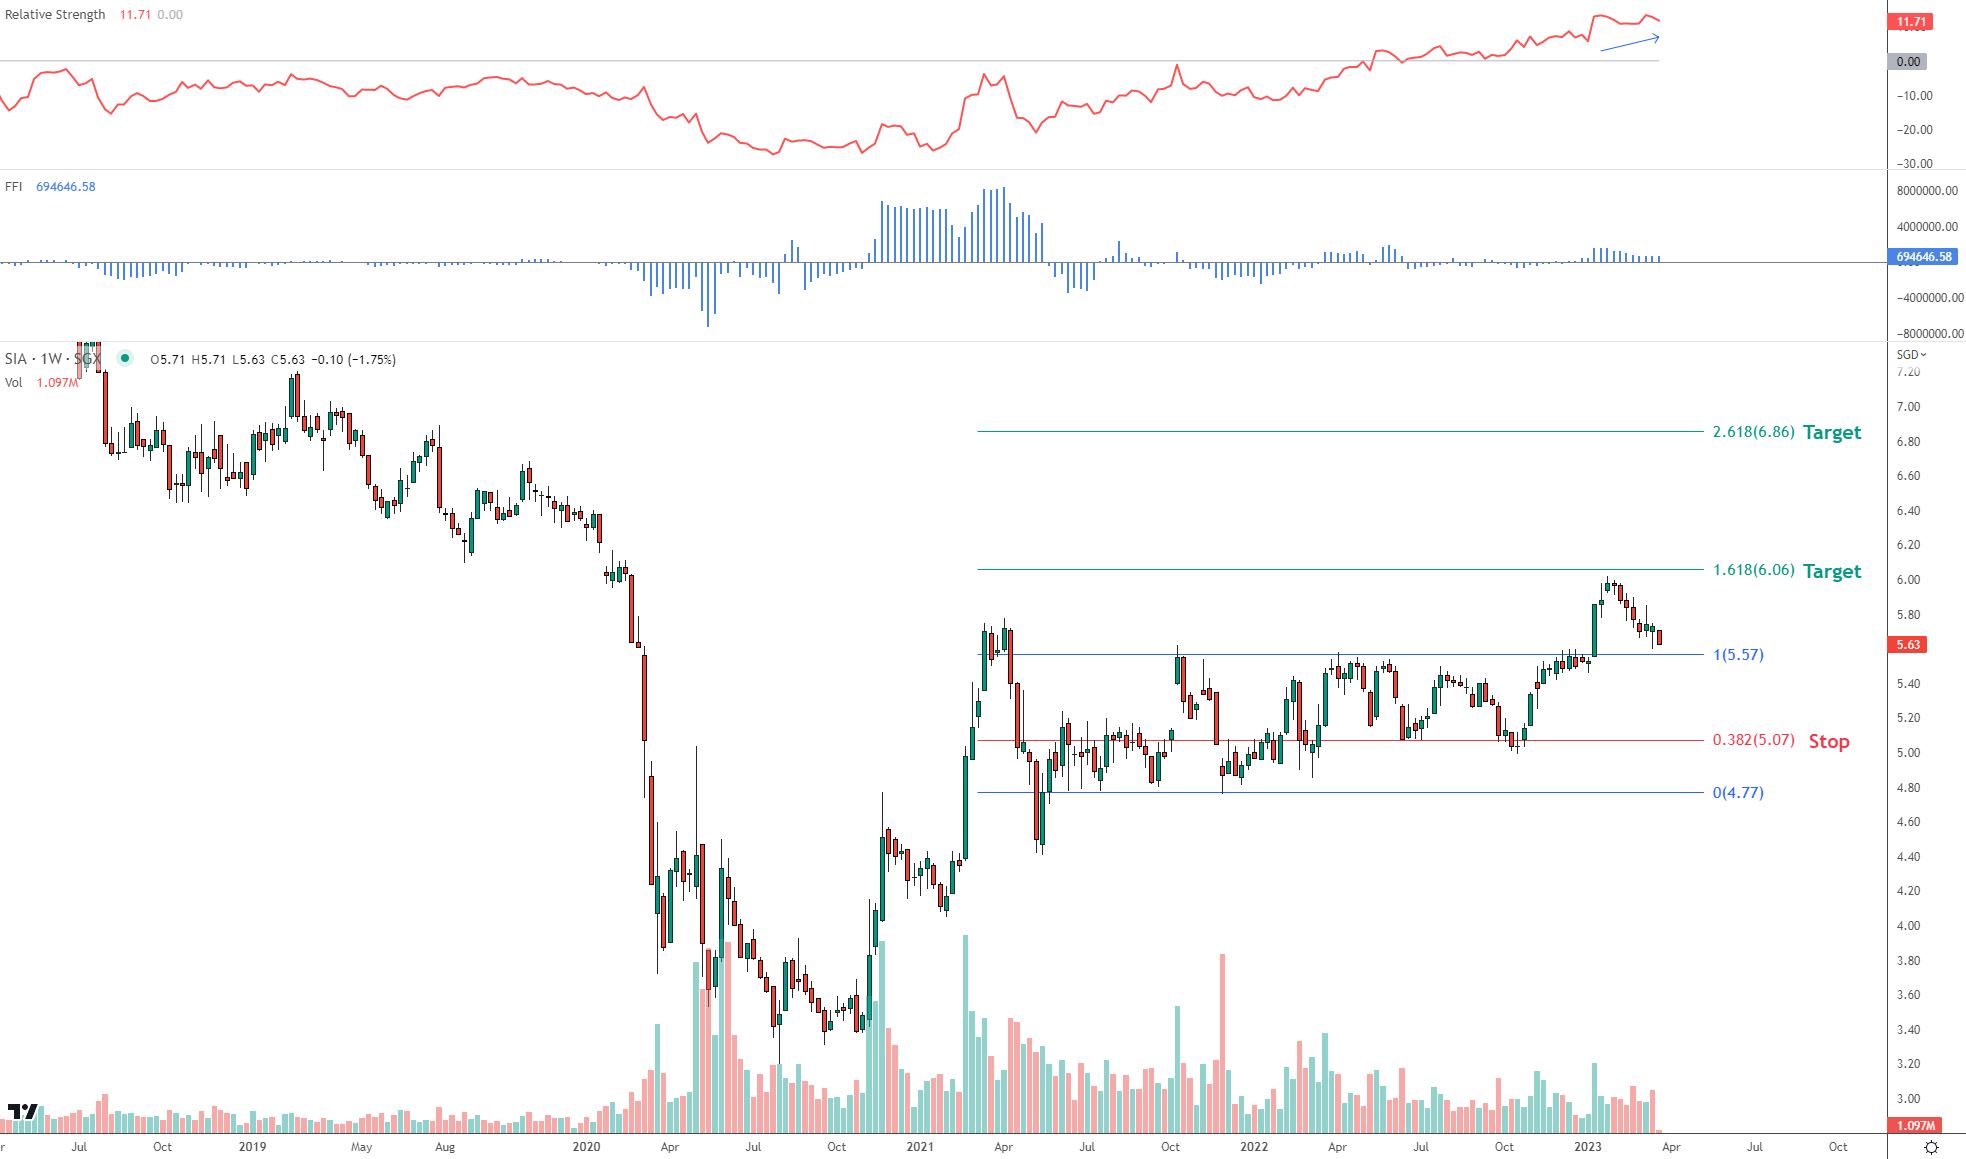
SIA (C6L): At technical support, expecting rebound
Price is trading at support-turned-resistance S$5.60 level.
Price holding above this level could see SIA trading higher technically towards S$6.06, with next target at S$6.86.
Blog disclaimers apply