Straits Times Index (STI) Technical View:
Secondary Trend (1-6mths) : Bearish
Short Term(1mths or less) : Neutral
Trading the
Long Term Trades : Not Preferred
Mid Term Trades : Not Preferred
Short Term Trades: Long Trade and Short Trade
Levels to watch:
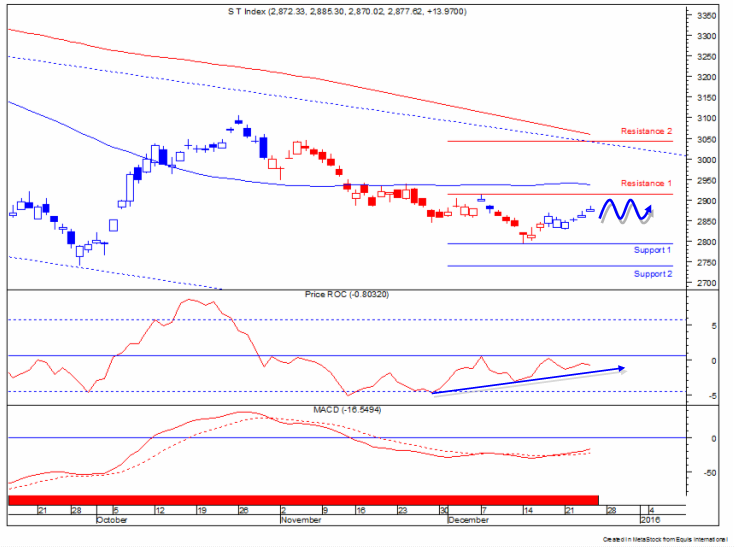
Resistance 2: 3,043
Resistance 1: 2,912
Support 1: 2,793
Support 2: 2,740
Probable STI Movement
Preferred : Sideway range between 2,800 - 2,900
Alternate : Downward trend towards 2,750
Remarks: STI maintained its sideway momentum with no breakout from its trading range. In view of the above, STI possible movement for the coming remains likely to rangw between 2,800-2900.
Comments on STI Technical View
Primary Trend is bearish as 55 Days SMA is trading below the 144 Days SMA, and 144 Days SMA continues to be downward sloping.
Secondary Trend is neutral as MACD bullish crossover signal is observed but trades below the zero line.
Minor Trend is neutral coupled with mild bearish as ROC(10) continues to move near but below its midpoint.
*Disclaimer Applies
Technical Terms (StockCharts.com):
Dow Theory
Moving Average Convergence/Divergence Oscillator (MACD)
Moving Average
Trend Line
Support and Resistance
Rate of Change (ROC)